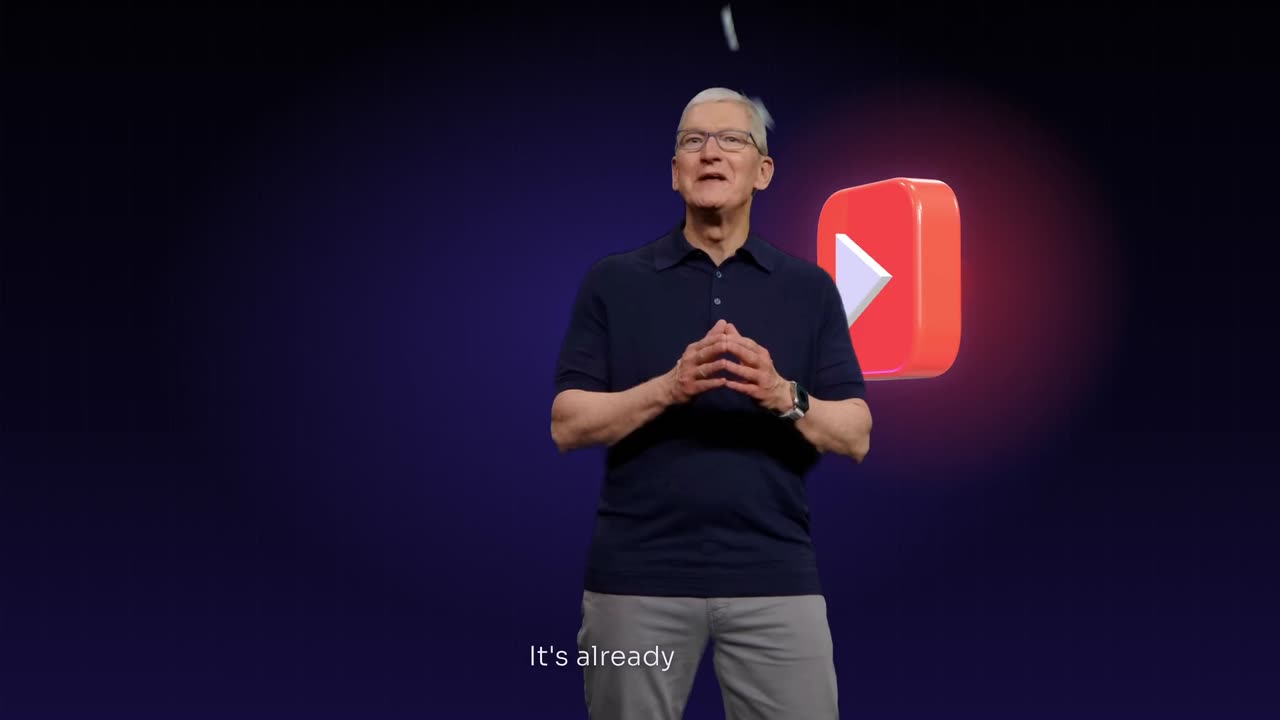
To add explainer graphics over a podcast clip, pick a 45 to 60 second moment that explains one idea, choose one visual style with one accent colour, and add three to five graphics timed to the spoken words: numbers count up, processes draw in as diagrams, names become cards. Cut between the speakers and full screen graphics, with small captions.
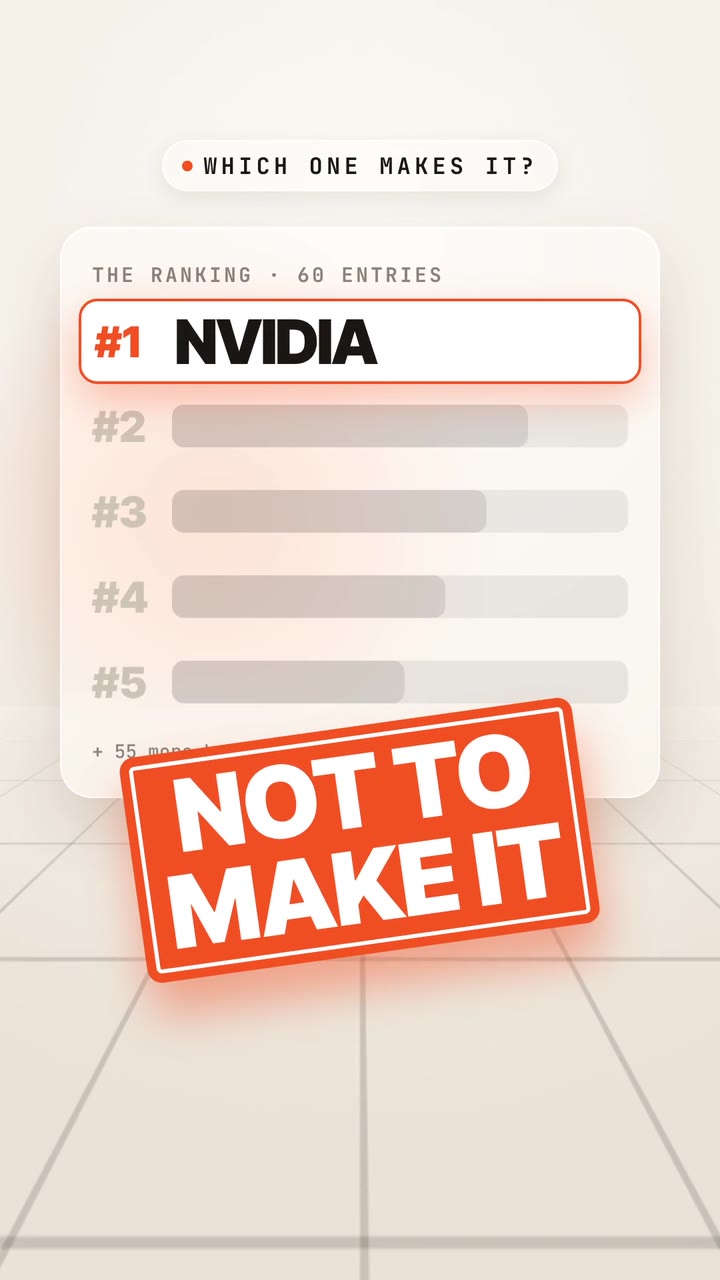
Real outputs from the Videotto template gallery.
When explainer graphics suit a podcast clip
This is not a page of random stickers over a talking head. Every graphic is a translation of a sentence the guest is saying, at the moment they say it. That works best on moments that explain something: how a thing works, a surprising number, a short history, a comparison. A funny story or a heated argument usually needs nothing more than good captions.
This page is about podcast and interview clips with two or more people. For a single person talking to camera, our guide to motion graphics on a talking head video goes deeper on layouts around one face.
Most explainer podcast clips use one of three layouts. Pick one and keep it for the whole series so viewers learn the format.
- Cut away. Speaker, then a full screen graphic for 2 to 4 seconds, then back. The cleanest option and the easiest to read on a phone.
- Split frame. The speaker in the bottom half, the graphic building in the top half. Good when the explanation runs for 10 seconds or more.
- Cut out on the page. The speaker with the background removed, standing on the same paper or stage as the drawings. The most designed look.
Podcast explainer graphics: specs and timing
These are starting values for a vertical clip. They are typical defaults, not rules, and the right numbers depend on how fast your guest talks.
| Setting | Starting value | What it protects |
|---|---|---|
| Format | 9:16 at 1080x1920 | Full screen on TikTok, Reels and Shorts |
| Clip length | 45 to 60 s; Shorts and Reels allow up to 3 min | Enough room for one idea and its payoff |
| Graphics per minute | 3 to 5 | Each one still stands out |
| Full screen graphic | 2 to 4 s on screen | Long enough to read, short enough to keep the speaker present |
| Timing | Lands on the spoken word, within a few frames | A number shown early spoils the line |
| Captions | Small, one or two lines, same place every time | Room for the graphics to carry the key words |
| Style | One base (paper, grid or dark stage) plus one accent colour | The clip feels like one piece |
| Sound | Soft pen or click sounds on each draw in, no music under voices | The conversation stays clear |
Explainer graphics prompt for a podcast clip
Shorter explainer graphic requests
Adapted from the way Videotto users brief Otto for explainer clips. Replace the link and the style details. Only clip podcasts you own or have permission to clip, for example through a clipping campaign run by the show.
- "Clip this into a 9:16 short in an old science book style: cream paper, fine line drawings that draw in as he explains."
- "Add a big number counter and a growth line that climbs when she talks about the results."
- "Black stage with a glowing grid, bar charts that build as he says the figures."
- "Cut out the speaker over the page and draw the diagram beside him."
- "Keep graphics to the three key ideas only, the rest is just the speakers."
[your YouTube link or uploaded episode]
Clip the strongest 45 to 60 second moment into a 9:16 explainer short.
STYLE: warm off white grid paper, one burnt orange accent #E8692C, dark ink lines.
LAYOUT: short cuts of whoever is talking, then full screen graphics on the key ideas.
GRAPHICS:
Every number counts up the moment it is said, keep every number exactly as spoken.
Any process becomes a simple diagram that draws in step by step.
A vertical timeline tracks the argument from start to end.
Ideas the guest rejects get a strike through.
CAPTIONS: small white captions, key words in orange, clear of the graphics.
SOUND: soft pen sounds on each draw in, no music under the voices.
RESTRICTIONS: never change what the speakers said, no graphics over faces, no bouncing.
Add explainer graphics to a podcast clip in 6 steps
- Bring in the episode. Paste a YouTube link or upload the file. Say whether you want Otto to find the moment or give it the exact start and end.
- Pick a clip with a clear idea. Look for a stretch where the guest explains one thing from start to finish, ideally with a number or a sequence in it.
- Choose one visual style. Old science book paper, warm grid paper, a dark stage with a glowing grid, or clean white. One style for the whole clip.
- Say what becomes a graphic. Numbers count up, companies become cards with plain names, steps become a diagram, rejected ideas get a strike through.
- Set the layout and captions. Short cuts of whoever is talking, full screen graphics on the key lines, small clean captions so the graphics have room.
- Check every fact on screen. Pause on each graphic and compare it with what was said. The graphic must match the speaker, not improve on them.
For comparison, doing this by hand usually means cutting the clip in Premiere Pro or CapCut, building each graphic in After Effects or Canva, then lining every one up with the audio. For a 60 second clip with four graphics, that is commonly two to four hours of work. A prompt gets you to a first version in minutes, and the time goes into checking.
Worked example: a 50 second podcast explainer clip
An illustration with an invented episode, to show how the transcript turns into graphics. The guest explains why a small coffee shop raised prices.
The moment (from the transcript): "Our beans went from 9 dollars a kilo to 14 in a year. We had three options: cut the size, switch beans, or raise prices. We tried switching beans and lost regulars in a week. So we raised a flat coffee from 4.50 to 5."
Graphics planned: four, matched to four phrases.
| Time | Spoken words | Graphic |
|---|---|---|
| 0 to 6 s | Host asks why prices went up | Speakers only, captions |
| 6 to 11 s | "9 dollars a kilo to 14" | Full screen: 9 counts up to 14, a short orange line climbs |
| 11 to 20 s | "three options" | Split frame: three boxes draw in one by one as he lists them |
| 20 to 27 s | "lost regulars in a week" | "Switch beans" box gets a strike through |
| 27 to 34 s | "4.50 to 5" | Full screen price card, 4.50 flips to 5.00 |
| 34 to 50 s | Host reaction and takeaway | Speakers only, captions, end on the guest |
Four graphics in 50 seconds, each on screen for 5 to 9 seconds of speech, with the faces back on screen between them. Every number shown is a number the guest said.
Podcast explainer graphics: problems and fixes
| Problem | Fix |
|---|---|
| A graphic on every sentence, so nothing stands out | Three to five graphics in a minute is plenty; let the rest be the speakers |
| Graphics that arrive before the words | Ask for each graphic exactly on the spoken word and check the timing |
| Facts the guest did not say | Only show what was said; never add a statistic or a claim |
| Graphics covering faces | Keep graphics away from faces or cut to full screen instead |
| Captions fighting the graphics | Make captions smaller and keep them in one fixed place |
| Clipping without rights | Use your own show, or one that runs a campaign or gives you permission |
When the explanation is a process with more than three steps, a dedicated diagram reads better than boxes over a clip. The process diagram guide covers that format.
FAQ
How do podcasts add animations to their YouTube clips?
Podcasts that add animations to their YouTube clips usually work from the transcript: they mark the lines with a number, a process or a name, then build a graphic for each and time it to the audio. Many teams use After Effects or Canva for the graphics and Premiere Pro for the edit. Others describe the graphics in a prompt and adjust the result.
How many graphics should a 60 second podcast clip have?
A 60 second podcast clip usually works with three to five graphics. That gives each one room to land and leaves time for the speakers' faces, which carry a lot of the emotion. More than one graphic every 10 seconds tends to feel busy, and viewers stop reading them.
Do explainer graphics help podcast clips get more views?
Whether explainer graphics help a podcast clip get more views depends on the moment. They help most when the idea is hard to picture from speech alone, such as numbers, processes and comparisons, and when people watch muted. They add little to a funny story or a strong emotional moment, where the faces and the words do the work.
What is the difference between a podcast audiogram and an explainer clip?
A podcast audiogram is usually a still image or cover art with a moving waveform and captions, often made from audio only. An explainer clip uses video of the speakers and adds graphics that illustrate what they say. Audiograms are faster to make for audio shows, while explainer clips suit video podcasts with ideas worth drawing.
Make your next video with Otto
Tell Otto what you want in plain words. It cuts, captions and animates the video for you.